What are the Normal PSA Levels as Per Age
Prostate-specific antigen (PSA) is a chemical protein produced by the normal as well as malignant cells of the prostate gland. Higher PSA levels may raise the chances of prostate cancer, a noncancerous ailment such as prostatitis or an enlarged prostate.
In most cases, men with PSA levels below 4 ng/mL (nanograms of PSA per milliliter of blood) bear a minimum risk of prostate cancer.

Understanding the PSA Levels Chart
Usually, a lot of experts consider PSA levels under 4 ng/mL to be normal. However, owing to some modern conclusions, a lot of experts now recommend dropping the cutoff levels to less than 2.5 or 3 ng/mL as a limit for normal values, particularly in the case of young patients. It is because younger patients have smaller prostates and consequently lower PSA values. Therefore, PSA levels greater than 2.5 ng/mL can be a reason for apprehension. To determine if you conform to the normal PSA levels age chart, a PSA test is conducted.
What is a PSA Test?
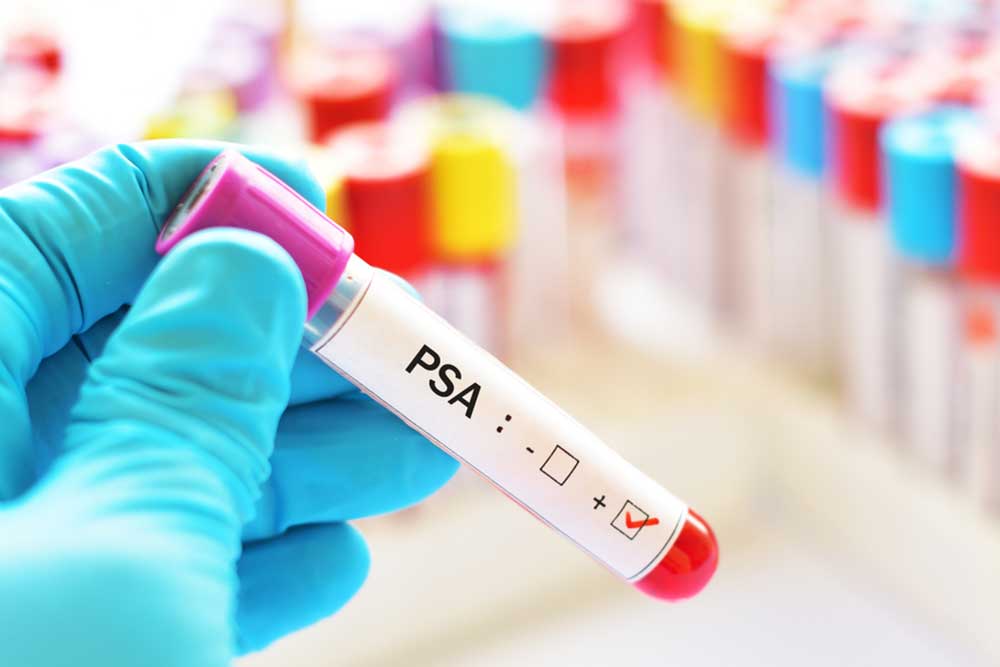
The PSA test is a blood test that measures the PSA levels in a person’s blood. It is conducted for detecting prostate cancer and for monitoring its treatment. PSA is only produced by the male prostate gland. In rare cases, it is found in some breast tissues in women. Hence, prostate cancer is mostly found in men. PSA is released into the semen, where it serves to liquefy the semen after ejaculation. Most of this PSA is ejected from the body via semen, but a very small amount of it enters the bloodstream. So normally, PSA is found in small quantity in the blood.
Normal PSA Levels Age Chart
As per the PSA levels chart, the normal range tends to increase with age. Higher PSA levels generally serve as the first indication of prostate cancer. After the blood test analysis, the resulting levels show much of the chemical is being produced by the body and the probability of being diagnosed with prostate cancer.
As per the PSA levels chart, the age-specific reference ranges for PSA are as follows:
- 40 to 49 years
0 to 2.0 ng/mL in Asian Americans and 0 to 2.0 ng/mL in African Americans. - 50 to 59 years
0 to 3.0 ng/mL in Asian Americans and 0 to 4.0 ng/mL in African Americans. - 60 to 69 years
0 to 4.0 ng/mL in Asian Americans and 0 to 4.5 ng/mL in African Americans. - 70 to 79 years
0 to 5.0 ng/mL in Asian Americans and 0 to 5.5 ng/mL in African Americans.
This PSA Levels Chart helps in understanding and determining the diagnosis of your PSA test. However, it is important to note that higher results do not necessarily mean you have prostate cancer. It just indicates a greater risk of developing it.


